Site menu:
Predicting Health Risks from Placental Functions
This website is prepared by Jen-Mei Chang, Ph.D. at California State University, Long Beach for the teaching of MATH479/579 in spring 2011. With the help of Dr. Carolyn M. Salafia MD MS, Perinatal Pathologist from the Placental Analytics, LLC, the ultimate goal of this ground-breaking study is to develop mathematically quantifiable placental measurements that can be used to better understand how newborn, childhood, and potentially adult diseases have their genesis in gestational stress. Particularly, Dr. Salafia and her research group have successfully made connections between shapes of placenta and child's birth weight; placental weight and birth weight; placental efficiency and placental shapes, to name a few. Albeit the efforts, it is still a hugely open problem how the shape of a placenta may help predict risks of adult diseases in a semi-automatic fashion.Background
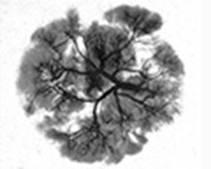
Recent medical research indicates that the placenta may be the "crystal ball" for the health of the baby. The placenta is the source of nutrition, oxygen, and blood for the developing fetus so any problems with the placenta may become a problem for the baby. An analysis of the placenta may help predict risks for certain diseases that develop in the womb such as diabetes, autism, and heart disease. In particular, the structure of the blood vessel network as well as the shape of the human placenta may contain important medical clues. In simplest terms, the vasculature is like an irrigation network for the placenta and if any part of the network is missing or unconnected then this may indicate that the placenta (and hence the fetus) did not receive adequate blood flow.
Project Description
Using placenta images provided by Placental Analytics LLC, you are encouraged to study any mathematical features of human placentas that could potentially be useful in making predictions about health risks in young adults. The ultimate goal is to provide doctors a method in using digital images of placentas to distinguish healthy vs. unhealthy babies.
Data
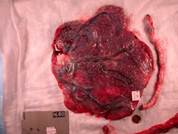
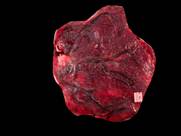
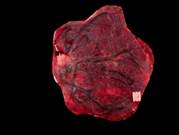
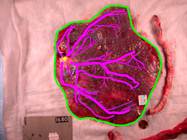
- Currently, we are able to collect full medical and image information on 145 subjects. The kinds of 2D images we have available on those subjects are depicted here and can be made available to you upon request (updated January 9, 2010).
- Some histology data can be made available upon request.
- Some 3D tubular scans can also be made available upon request.
- Placental Analytics LLC.
- A presentation on Reconstructing Placental Shape and Surface Vasculature for Analyses of Pregnancy Stress [PDF, 12.6 MB] by Dr. Carolyn Salafia.
- Modeling Placental Growth and Structure. IPAM summary.
- Automated Vasculature Extraction from Placenta Images [PDF, 9.39 MB]. UCLA Summer 2009 REU report.
- Placenta Imaging Classification: At Risk Detector (PICARD) [PDF, 2.81 MB]. UCLA Summer 2010 REU report.
- Yampolsky M, Salafia CM, Shlakhter O, Haas D, Eucker B, Thorp J., "Modeling the Variability of Shapes of a Human Placenta," [PDF, 2.55 MB] Placenta. 2008 Sep;29(9):790-797.
- Salafia CM, Yampolsky M, "Metabolic Scaling Law for Fetus and Placenta," [PDF, 218 KB] Placenta. 2009 May; 30(5):468-471.
- Salafia CM, Yampolsky M, Misra DP, Shlakhter O, Haas D, Eucker B, Thorp J., "Placental Surface Shape, Function, and Effects of Maternal and Fetal Vascular Pathology," [PDF, 3.73 MB] Placenta. 2010 Nov;31(11):958-962.
- Homework 1 (individual): Answer the question “what are your personal objectives for this class and what do you plan to accomplish by the end of the semester?”
- Homework 2 (individual): : Write a MATLAB code that computes and displays (1) the mean vector of the following 3 images and (2) the eigenvectors that correspond to non-zero eigenvalues of the covariance matrix formed after mean subtraction of the following set of 3 images as 5-by-4 array of black squares. These eigenvectors, when normalized, form a basis for the data set spanned by those three images and are called the principal components of the data set. (Note: proceed by assuming that the black square entries have numerical value 1 and the blank entries have numerical value 0. Concatenate the columns of each pattern to make vectors in a 20-dimensional space.) LaTeX your code and results.
- Homework 3 (group): Write a paragraph that describes the problem your group intends to study and why. Write another paragraph that describes how your group intend to tackle the problem mathematically and estimate how long it might take. Assign tasks within your group. Describe briefly who is responsible for what and the amount of time allocated for the tasks.
- Homework 4 (group): Weekly progress report: what your group has accomplished and what you plan to do next.
- Homework 5 (group): Weekly progress report: what your group has accomplished and what you plan to do next.
- Homework 6 (group): Annotated Bibliography. See the following for an example:
- Homework 7 (group): Weekly progress report: what your group has accomplished and what you plan to do next.
- Homework 8 (group): Midterm presentation. Please email me a compressed/zipped file that includes all of your auxiliary files used to in your presentation.
- Homeworks 9-12 (group): Weekly progress report: what your group has accomplished and what you plan to do next.
- Homework 13 (group): Final presentation. Please email me a compressed/zipped file that includes all of your auxiliary files used to in your presentation.
- Homework 14 (group): Final Report and all deliverables. Note: your final report should consist at least the following information/sections: (1) name, affiliation; (2) abstract (no more than 150 words); (3) introduction; (4) research method(s); (5) results; (6) future work; (7) conclusions/summary; (8) references; (9) acknowledgement.
| Original (LabID 1680) | Cropped | Cropped and Deglared | Placental Plate Mask |
|---|---|---|---|
 |
 |
 |
 |
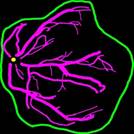
| Traced Vessel Network Whole | Traced (Only) Vessel Network | Vessel Network Extracted | Scaled and Oriented by Eigen-Analysis |
 |
 |
 |
 |
Some References
Homework
Please click on the appropriate link for the course syllabus and schedule.


 Note: you may use JabRef to organize your references or simply use your LaTeX editor to update your .bib file. For example, an entry in your .bib file may look like the following:
@ARTICLE{Yampolsky2009,
author = {M. Yampolsky and C. Salafia and O. Shlakhter and D. Haas and B. Eucker and J. Thorp},
title = {Centrality of the Umbilical Cord Insertion in a Human Placenta Influences the Placental Efficiency},
journal = {Placenta},
year = {2009},
volume = {30},
pages = {1058-1064},
comment = {Previous works of Dr. Yampolsky on human placenta and placental pathology.},
owner = {sheauguai},
timestamp = {2010.06.24},
notes={},
}
After bibtex compilation, the entry looks like the following in the pdf output:
[12] M. Yampolsky, C. Salafia, O. Shlakhter, D. Haas, B. Eucker, and J. Thorp. Centrality of the Umbilical Cord Insertion in a Human Placenta Influences the Placental Efficiency. Placenta, 30:1058-1064, 2009.
| Presentation title | Team members |
|---|---|
| Modeling of Measurable Maternal Attributes [PDF, 611 KB] (MOMMA) | Diana Amador, Andrew Dempsey, Samantha Godfrey, Peter Steinhoff |
| Vein Tracing | Nen Huynh, Jennifer Meyers-Giddings, Zac Schoenrock, Marilyn Vazquez |
| Team Blob [PDF, 4.29 MB] | Austin Adams, KC Skubic, Leighann Van Deventer, G.D. Young |
| Surface Modeling [PDF, 8.49 MB] | Daniel Macias, Mutaz Alsayegh, Ramy Heng, Rattana Hor |
| Classification using Machine Learning Algorithms [PDF, 3.46 MB] (MALA) | Rodrigo Farnham, Tuyen Ly, Jason Wang |
| Placental Maturity Analysis [PDF, 8.94 MB] | Sarah Grefe, Raymond Ahn, Mariana Reyes, Jose Ruiz |
| Extracting Placental Blood Vessels From 3D Data [PDF, 19.20 MB](PWACA) | David Harr, Hung Trinh, Nancy CheMahan |
| Presentation title | Team members |
|---|---|
| Modeling of Measurable Maternal Attributes (MOMMA) [PDF, 1.52 MB] (MOMMA) | Diana Amador, Andrew Dempsey, Samantha Godfrey, Peter Steinhoff |
| Vein Route Tracing [PDF, 5.88 MB] (VRT) | Nen Huynh, Jennifer Meyers-Giddings, Zac Schoenrock, Marilyn Vazquez |
| Team Blob [PDF, 13.2 MB] | Austin Adams, KC Skubic, Leighann Van Deventer, G.D. Young |
| Surface Modeling [PDF, 11.2 MB] | Daniel Macias, Mutaz Alsayegh, Ramy Heng, Rattana Hor |
| Classification using Machine Learning Algorithms [PDF, 5.87 MB] (MALA) | Rodrigo Farnham, Tuyen Ly, Jason Wang |
| Placental Maturity Analysis [PDF, 5.87 MB] | Sarah Grefe, Raymond Ahn, Mariana Reyes, Jose Ruiz |
| Extracting Placental Blood Vessels From 3D Data [PDF, 18.30 MB] | David Harr, Hung Trinh, Nancy CheMahan |
| Report title | Team members |
|---|---|
| Modeling of Measurable Maternal Attributes (MOMMA) [PDF, 846 KB] (MOMMA) | Diana Amador, Andrew Dempsey, Samantha Godfrey, Peter Steinhoff |
| Vein Route Tracing [PDF, 1.51 MB] (VRT) | Nen Huynh, Jennifer Meyers-Giddings, Zac Schoenrock, Marilyn Vazquez |
| Image Segmentation of Histology Slides [PDF, 12.1 MB] | Austin Adams, KC Skubic, Leighann Van Deventer, G.D. Young |
| 3D Placenta Image Construction [PDF, 2.01 MB] | Daniel Macias, Mutaz Alsayegh, Ramy Heng, Rattana Hor |
| Classification using Machine Learning Algorithms [PDF, 814 KB] (MALA) | Rodrigo Farnham, Tuyen Ly, Jason Wang |
| Placental Maturity Analysis [PDF, 13.3 MB] | Sarah Grefe, Raymond Ahn, Mariana Reyes, Jose Ruiz |
| Mapping Placental Vessel Networks using Triangular Mesh Topology [PDF, 475 KB] | David Harr, Hung Trinh, Nancy CheMahan |