![]()
Activity - Excel
The main goal of this activity
is to practice some features of Excel presented in class. Particularly, this
activity helps you to learn how to make charts and graphs in excel.
1- Create
three rows of excel. In first row first type x and then in next cells type
different values of x = 1,2,3,4,…etc. In the second
row first type “4x-14” and then in the next cells have Excel to calculate
different values of 4*x-14= -10,-6,
-2,…etc. In the third row type 4-2x and in the next columns have Excel to
calculate different values of 4-2x=2, 0, -2,.. etc.
Students then will notice that only if x=3 the values of 4x-14 & 4-2x are
equal.
Draw a graph of two lines that will
cross at the point where x=3.
Hint
You
may use my (excel Help) in my PowerPoint list. Hint:
You need Adobe Flash player to see the video.
|
X |
1 |
2 |
3 |
4 |
5 |
6 |
7 |
|
|
4X-14 |
=4*B1-14 |
|
|
|
|
|
|
|
|
4-2x |
|
|
|
|
|
|
|
|
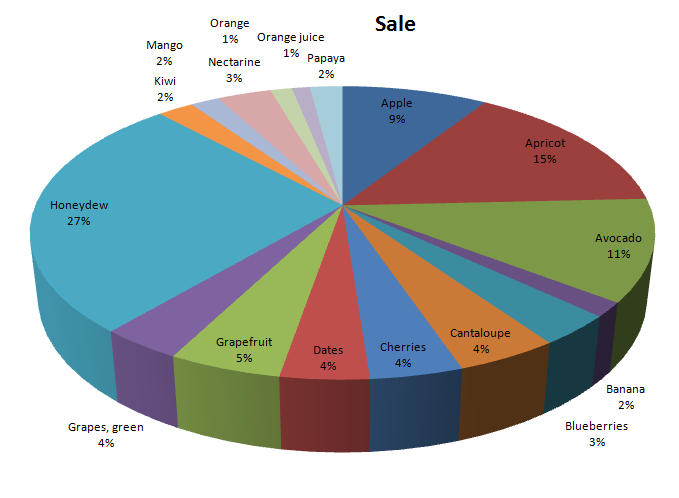
2- Use
the attached data
to create a pie chart
like this.
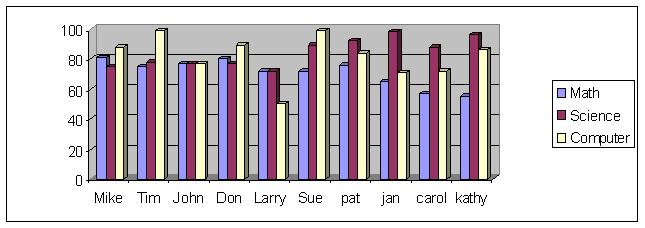
3- Use the attached scores of 10 students in math, science, and
reading and draw charts to
a) Compare the
scores of individual students in math, science, and reading. (courses attached
together, student names separate) see example1
b) Compare the
performance of all students in math, science, and reading. (student names
attached together, courses separate) see example 2. Hint:
Right Click on the above chart & then use “select data” and then “Switch
Data”.
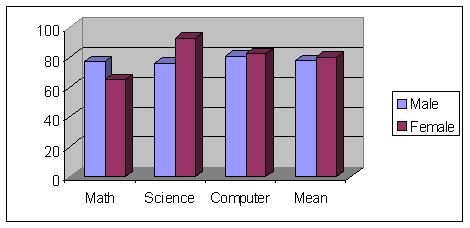
c) Compare the
performance of male and female students in math, science and reading (genders
attached together courses separate) see example 3. Hint:
create anew table with gender (male, female) in the
first column.
d) Compare the
performance of male and female students in math, science and reading (courses
attached together genders separate) see example 4
List of tutorials for
excel
1. Getting Familiar
with Microsoft
Excel
2. Some video clips of Basic Excel skills
3. http://www.baycongroup.com/el0.htm