No. 1
among national universities in promoting social mobility
(U.S. News & World Report, 2023)

Number 5 most-applied-to
university, Fall 2023
(collegetransitions.com)
Number Elevated to 'Doctoral
University:
High Research Activity' status
(Carnegie Classification of
institutions of Higher
Education, 2022)
Number‘The
Best Colleges in America 2023’
4.5 stars out of
5
(Money.com)
In the Top 10% of schools
nationwide for return on investment
(Georgetown University’s Center on Education
and the
Workforce, 2022)
$126,000 mid-career pay
(payscale.com,
2023)
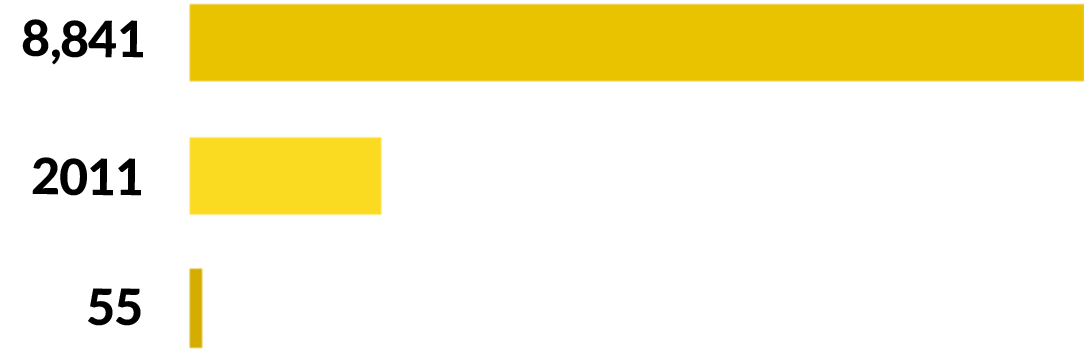
$1.88B
CSULB's economic impact
in the state
$8.23B
state economic impact
by Beach
alumni
Among the Top 50 'national
universities'
(Washington Monthly,
2023)
39,530
enrolled students, Fall
2023
34,033
undergraduate
students
(Fall '23)
5,497
graduate
students
(Fall '23)
$5,742
full-time
California
resident
undergraduate
tuition
and fees
$254M
total scholarships
and
grants
for 2022-23
academic
year
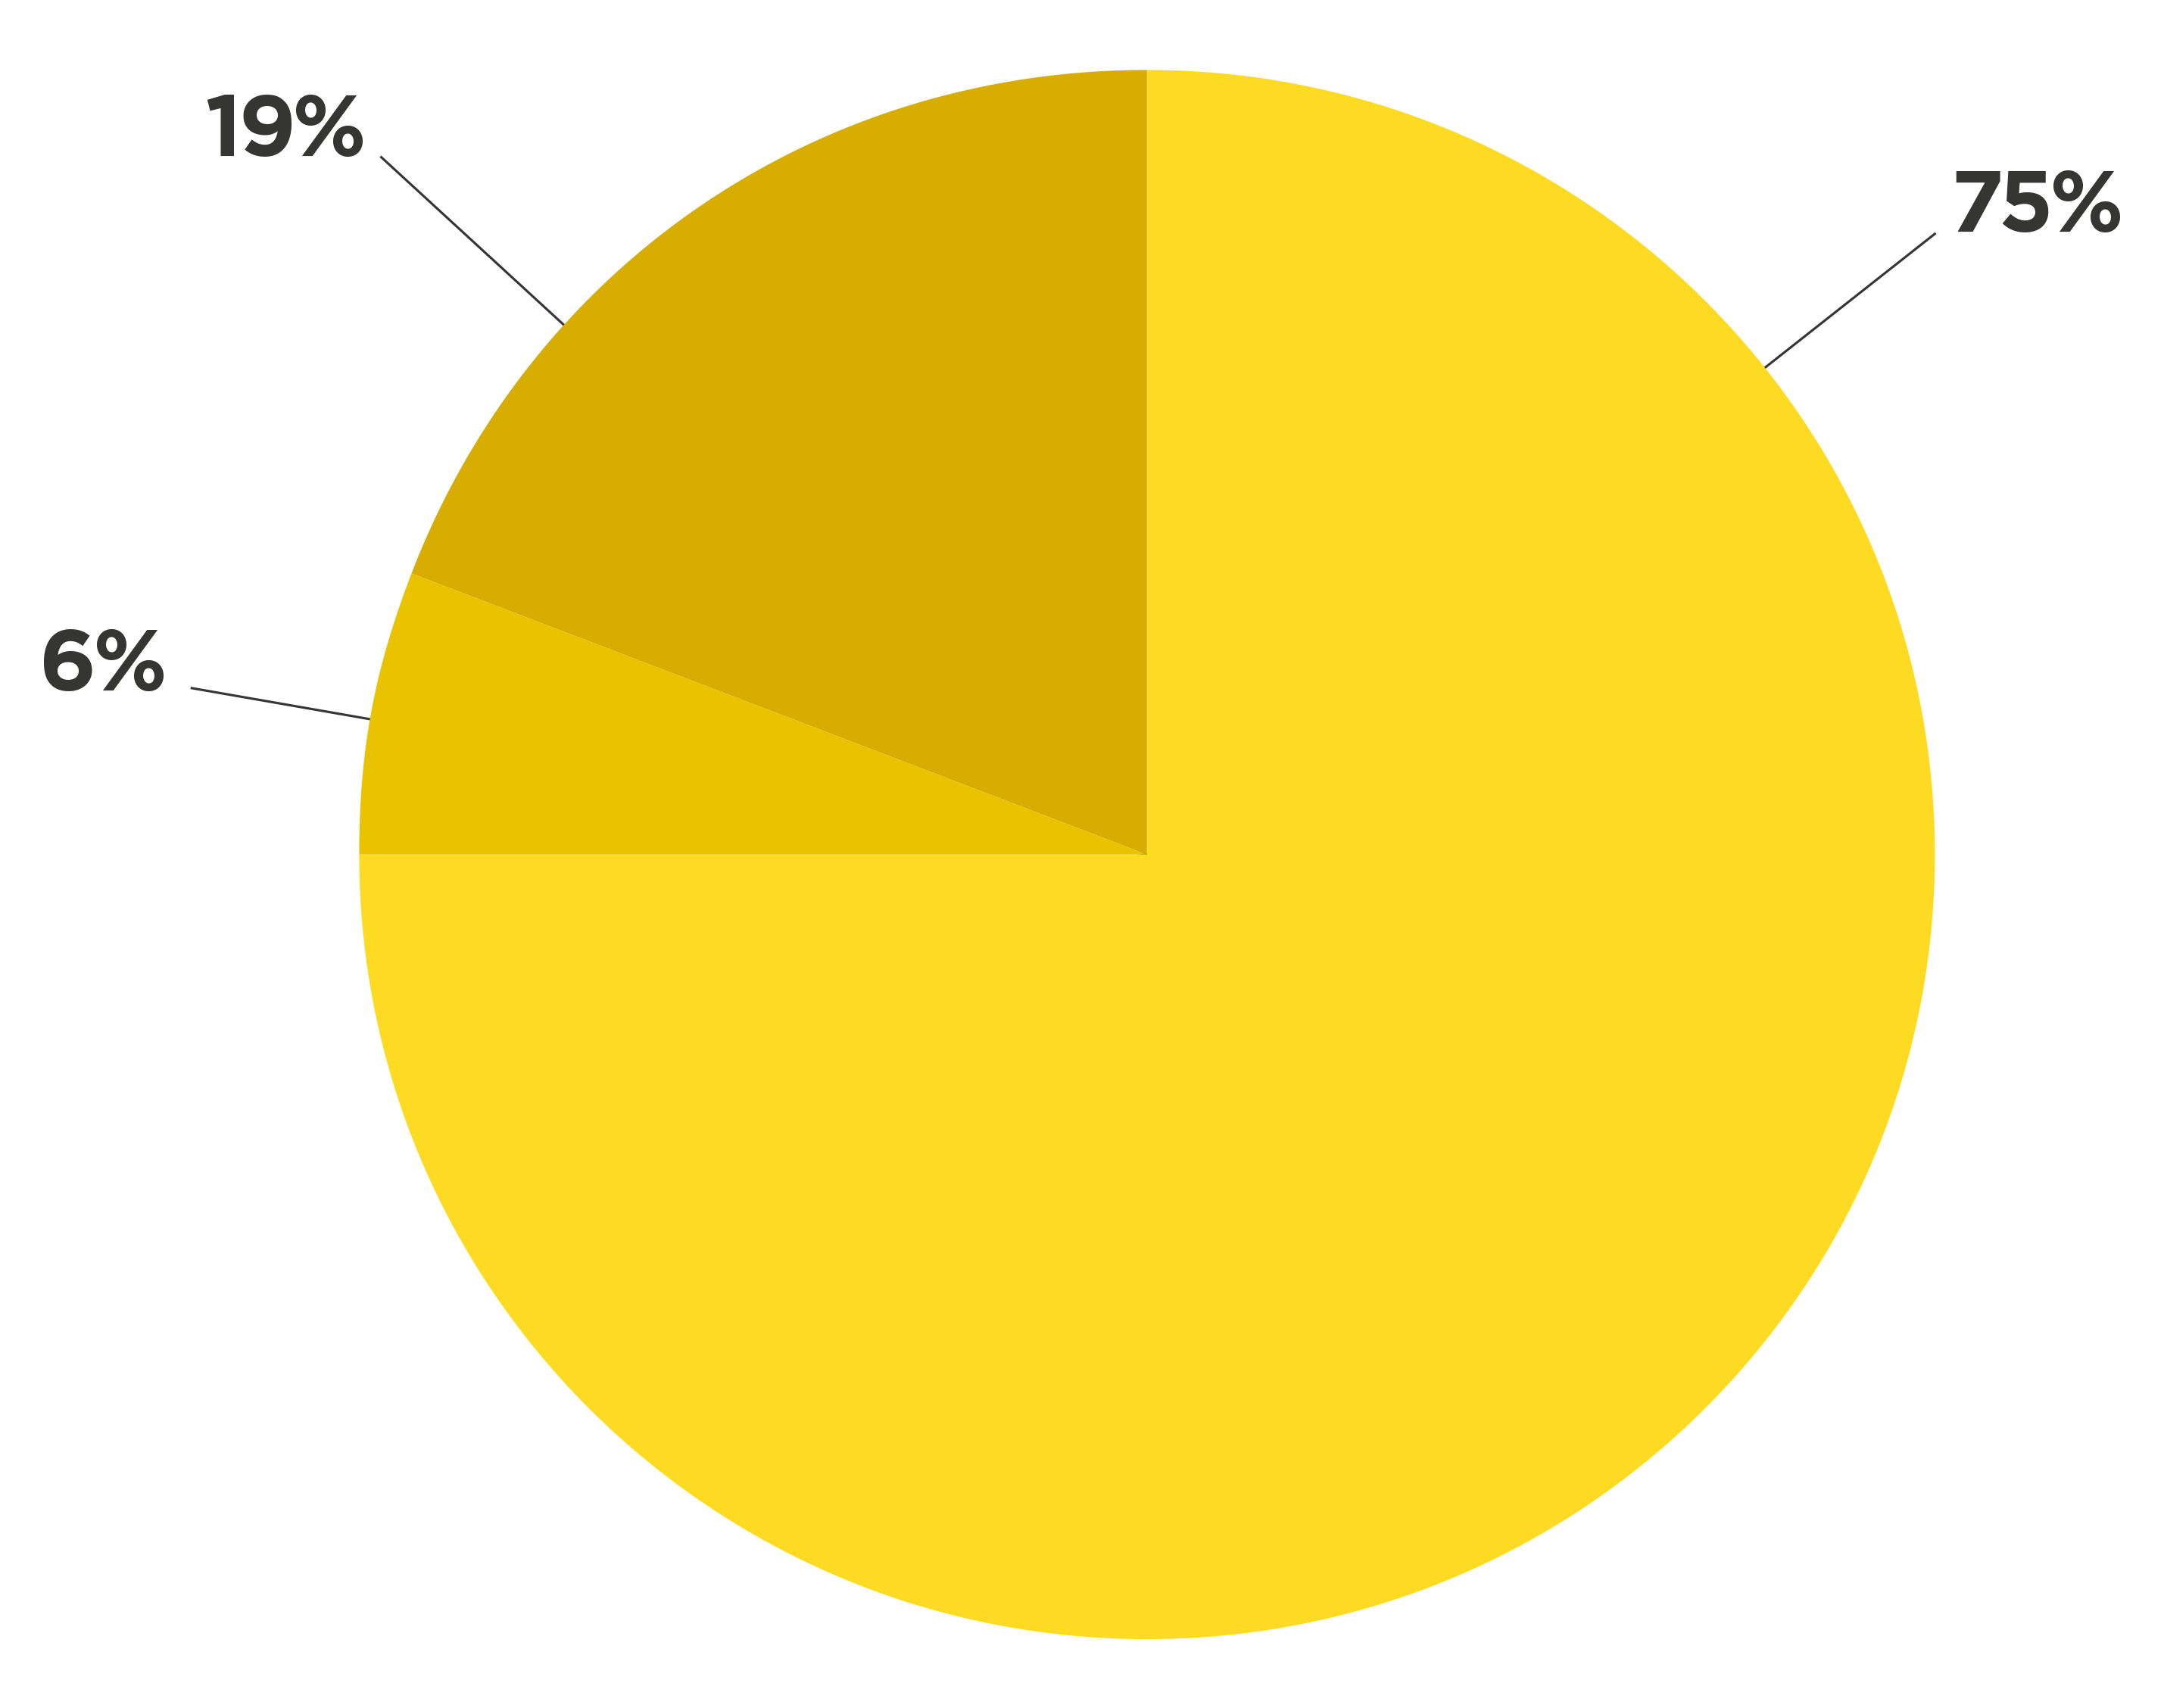
72%
undergraduate
students receive
some
form of
financial aid
$16,038
full-time non-CA
resident
tuition and fees
54%
of bachelor's
degree
recipients are
first in
family to receive
a university degree
$8,066
average
need-based
scholarship award
(full-time
undergraduates)
50%
of undergraduates
were
eligible for Pell grants
Estimate for the fiscal year ending June 30, 2024
10,907
Total Degrees
Awarded
2,432
Total Instructional Faculty
1,048
Full-Time Faculty
1,384
Part-Time Faculty
26:1
Student to Faculty Ratio
939
Faculty who are members of a minority group
45
Faculty who are international
190+
Academic
Programs
Offered